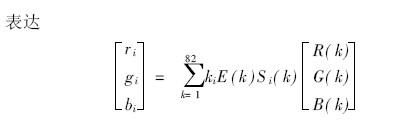
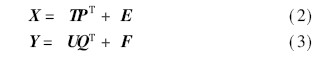
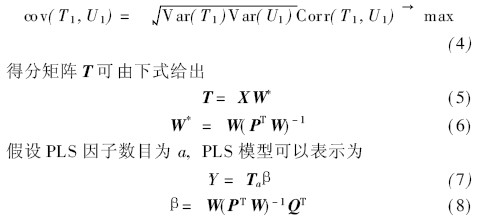
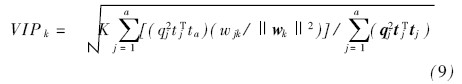
Introduction Color vision system is an important part of quality online inspection. It has a wide range of applications in textiles, food, plastic products and some industrial inspections. In many online detection applications, when the image background has multiple colors and is relatively cluttered, it is likely that the detection target will be difficult to distinguish. The resolution between the background and the background becomes very small [1, 2]. Scribner [3] and so on use two or more infrared bands to blend into a color image to distinguish between the target and the background surface. For color vision systems, the color signal is mainly affected by the reflection function of the surface of the object and the spectral energy distribution of the light source before imaging [4]. Choosing the right source band improves the resolution of the detection surface and simplifies the visual inspection algorithm. The partial least squares (PLS) method is often used for the selection of a single band [5~7] or band spacing [8~10]. Many papers describe their algorithms and applications [11~13]. Elmas ry [6] et al. studied the PLS algorithm and stepwise discriminant method to select the effective band to distinguish the injured part from the normal apple surface. Hyperspectral imaging techniques are often used to select the optimal band, but for some industrial automated inspections, the system is too expensive. With the development of LED technology, there are more and more types of LED bands, and its brightness and band are more suitable for industrial automatic detection applications. However, LEDs do not provide a single band and generally have a certain band range. Therefore, this paper applies PLS analysis to study the selection of the source band spacing. Band spacing, in other words, picking the most efficient band group. Based on the PLS model, the study of band spacing is as follows: boo tstrap VIP method [8], interval partial least squares regression [9], boo tstrap method in partial least squares regression [10]. In this paper, the surface with multiple colors is selected as the experimental object, in order to distinguish and improve the resolution at the same time, select the appropriate light source band interval. Firstly, the reflection function of each surface is calibrated, then each surface type and reflection function are modeled by partial least squares method. The threshold value VIP > 1 0 is used as the basis for selecting the interval of the light source band. The selected band spacing was used as the LED band of the light source used in the experiment, and the validity of the selected band was verified experimentally. 1 color vision system The color vision system used in the experiment consists of three parts: (1) IMprex color CCD (IPX-2M30-GCCI), standard lens LM35HC; (2) optional band LED light source; (3) sample placement table. The camera has a resolution of 1 600X1200 pixels and a spectral range of 400 to 1 000 nm. The LED light source adopts the indirect illumination mode, and the high diffuse reflectivity hemispherical inner surface uniformly reflects the light emitted from the LED array onto the detection plane, thereby obtaining better color mixing effect and uniformity. 2 mathematical model The color picture is the characteristics of the object itself, the angle of the incident light source and the light source, and the spectral characteristics of the color CCD camera are complex [14]. The continuous spectrum can be replaced by some equidistantly spaced points. Limited by the instrument, take a point every 4 nm, the RGB value of the picture Ïi = ( ri , gi , bi ) T can be obtained from Where (R(k), G(k), B(k)) is the spectral response function of the camera, which can be determined by the camera, E(k) is the spectral distribution of the source, and S i (k) is the surface reflection of the pixel i of the object rate. Therefore, the Ïi = ( ri , gi , bi ) T acquired by the camera is closely related to the reflection function of the surface of the object. The reflection functions of the different surfaces constitute the independent variable Ssurfa ce , and all surfaces constitute the dependent variable N surface . The partial least squares method is used for the analysis of the band selection, and a mathematical model is established between the independent variable X (Nsurfa ce XK interv als ) and the dependent variable Y (N surface X 1). X and Y can be expressed as Where T and U are the scoring matrices of X and Y, respectively, and P and Q are the load matrices of X and Y, respectively. Y is a column vector, so Q is a unit vector. E and F are the residuals of the matrix. The main components T1 and U1 extracted from the two sets of variables, the PLS decomposition method is to make the covariance between T1 and U1 the maximum, which can be expressed as [11] Where Y is the predicted value and β is the regression coefficient. In the PLS model, the VIP (importance of variables in the projection direction) score is often used as the basis for band selection, reflecting the importance of each band to the surface type Y. The VIP score on the kth band interval can be expressed by the following formula [15] Where j = 1, 2, #, a, K is the number of band intervals, wj k is the weight of the kth band and the jth PLS factor, and tj, wj and qj are the numbers of T, W and Q, respectively j Column column vector. Band spacing with a high VI P score is considered to be more related to surface type Y. The band spacing of VIP > 1.0 is highly correlated, 0 8